October 20, 2025
Pivoting Away From Traditional Fixed Income

This piece is part of our series on the recalibration of investment tools and portfolio design.
U.S. fixed income has been a reliable diversifying asset since the early 1980’s when the Federal Funds Target Rate reached 20% to combat rising inflation. Now, forty years later, fixed income yields are at a generational low and will not provide investors the return and diversifying benefits previously enjoyed. The immediate implication is that the commonly utilized 70/30 or 60/40 portfolio construct has substantially more risk than it has had in decades. Real rates of return in U.S. government and investment grade corporate fixed income are now negative. The shifting investment landscape requires us to recalibrate our tools, it requires agility, vigilance, and it requires avoiding antiquated paradigms that have been rendered obsolete. Failing to make this adjustment is likely to lead investors clinging to old asset allocation models to undershoot their long-term return targets.
Aggressive purchases by the Federal Reserve of government, corporate, municipal and even high yield bonds further complicate the investment landscape. The adage “buyer beware” seems appropriate for many fixed income opportunities when balancing low returns with the potential for meaningful drawdowns, either via credit deterioration, rising interest rates and potentially one day the sale of fixed income securities by the Federal Reserve. Chart 1 shows bond yields at multi decade lows and historical drawdowns on principal that are noteworthy.
Moral Hazard
The nearly limitless ability of the U.S. Treasury and the Federal Reserve to support the economy has important ramifications for allocators of capital. In addition, the hastily conceived nature of some of these emergency programs makes long-term outcomes unpredictable. It is striking to consider that the Federal Reserve is the third largest investor in the largest corporate bond ETF, owns positions in sixteen other ETFs and also owns ample amounts of municipal and high yield debt. Are these now risk-free assets or will the Fed eventually move away from them? Importantly, where does the line of solvency get drawn and how will investment managers respond? Do credit spreads adequately compensate investors for the underlying risks? Given these challenges facing fixed income investors, we believe the risk/reward is asymmetric to the downside.
Many pundits argue that deflation is the greatest near-term risk, while others argue inflation is nearer than many expect. Current Federal Reserve reflation policy initiatives suggest rates may stay low, but it is unknowable where rates will be in 2-4 years. If rates were to rise in response to increased inflation expectations, normalizing Fed policy, a loss of confidence, or a weakening U.S. dollar, investors could experience principal loss on their longer duration fixed income investments. After a forty-year bull market in bonds complacency is likely, which means investors are not prepared for rising interest rates when it happens.
Chart 1
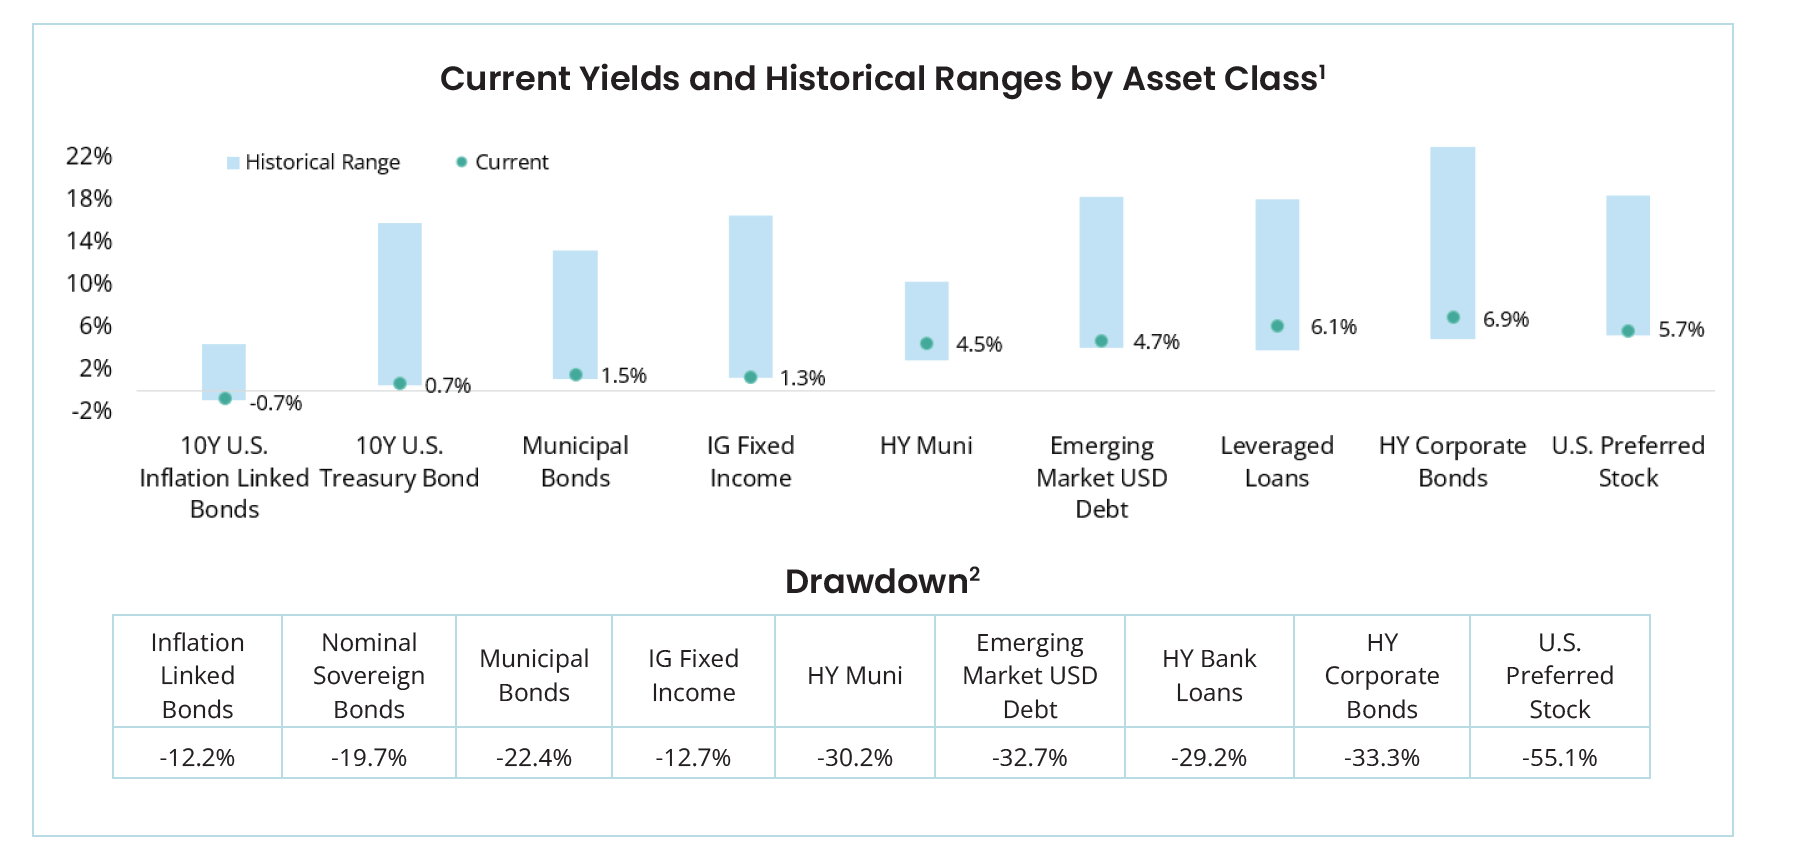
Source: S&P, Bloomberg. Data as of July 22, 2020.
Avoid Structural Complexity
To generate bond-like income and diversification benefits, some investors have resorted to structured product solutions. Structured products are expensive derivative-based contracts priced to achieve a specific outcome, but with no guarantee that the specific outcome will happen. The imbedded investment theme can be very attractive, but it is often too dependent on timing, which is unpredictable. Importantly, while the investor owns a sub-optimal security with no guarantees, the “entity” that structures the investment will always make money. This makes structured products unattractive in our view.
The uniqueness of hedge funds has also been severely diluted. While there are some excellent managers, the structure of the funds is typically costly and has been an unreliable source of consistent risk management and return. In the past 20 years as shown in Chart 2, hedge fund net returns have experienced a noteworthy decline. In 2007-8, our client portfolios had as much as 40% deployed to hedge fund managers, today it typically is around 10%. Hedge Funds have lost much of their appeal due to too much capital chasing harder to find returns. We plan to invest in carefully selected hedge fund managers but have a much higher threshold for deploying capital to this structure.
Our Solution
The challenge of replacing 30%-40% of a portfolio to achieve a historically consistent return target while still maintaining portfolio diversification is a major focus. The temptation for many allocators is to reach for yield, which risks permanent impairment of capital, elevated marked to market volatility, or greater drawdown risk as noted earlier. As there are no free lunches, one must assume different risks to generate necessary returns. These risks can include less liquidity, lower credit quality and/or higher volatility. Consequently, we have been utilizing several higher returns, diversification, and low correlation to equities, including managers that specialize in direct lending, music royalties, reinsurance, life insurance settlements, litigation finance³ and relative value credit. Many of these strategies are capacity constrained and have barriers to entry such as domain knowledge, and/or have an ample margin of safety that compensate investors for any additional assumed risk such as credit quality or lower liquidity. They also avoid risks found in traditional fixed income today such as being over-crowded and long(er) duration, which is susceptible to a decline in principal with an increase in future interest rates.
Chart 2: A Proliferation of Hedge Funds Globally has Led to Increased Competition and Lower Returns
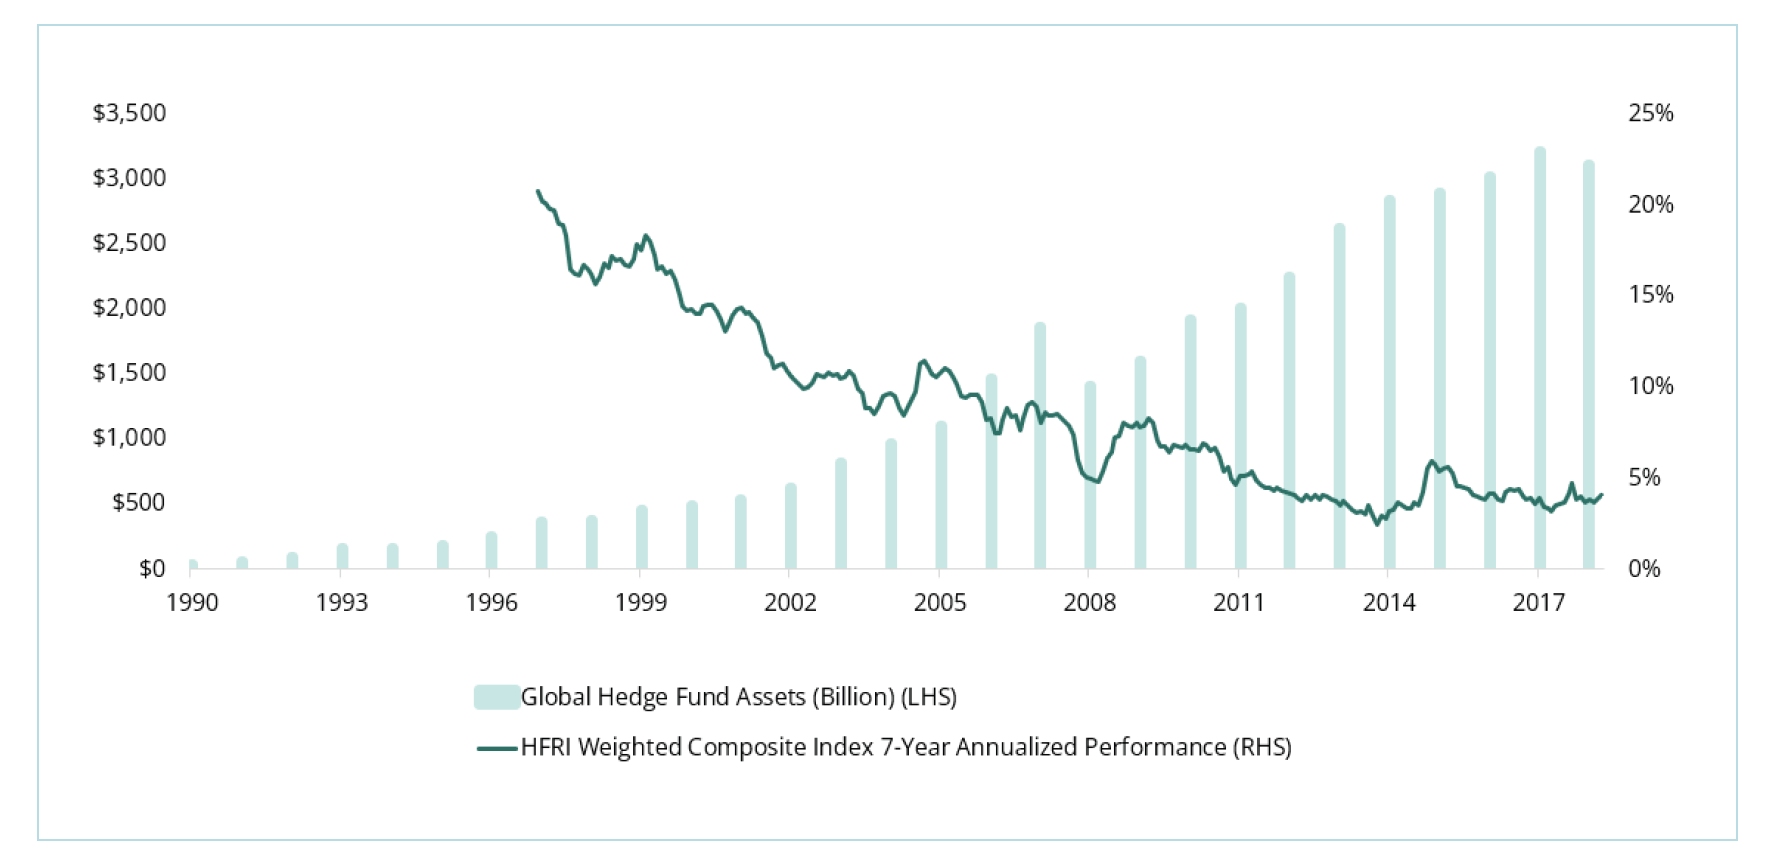
Source: Bloomberg, HFRI Fund Weighted Composite Index.
Examples of these niche investments include:
- Music Royalties – a diversified portfolio of digital music rights, supported by seasoned catalogues of mature music rights with stabilized cash flows and target net returns of 12-14%, and potential upside at exit.
- Life Insurance Settlements – a highly diversified portfolio of previously settled life insurance contracts, focused on healthy policy holders with target net returns of 13-15%.
- Reinsurance – a diversified portfolio of industry loss warranties across four primary dimensions: type of peril, geographic region, severityof loss and structure with a targeted net return of 7-9%.
- Relative Value Credit with Hedging – seeks to capitalize on structural discrepancies in the credit derivatives market driven by regulatory changes in the financial sector. Strategy generates a positive carry of which half is used to buy put options on credit markets with a targeted net return of 6-10%, while maintaining optionality and material downside protection.
- Direct Lending – targeting a 12-15% net internal rate of return (IRR) with an average expected duration of 2-3 years. The loans are corporate, highly collateralized with an emphasis on downside protection, and focused on Asian markets where banking rules are different than the U.S., leading to notable inefficiencies and opportunities.
- Litigation Finance – an uncorrelated and diversified return stream that selectively partners in complex commercial litigation where there is little competition and domain knowledge is an important asset. The strategy seeks a 13-16% net IRR over a multi-year timeframe.
Our conclusion is that to generate strong risk adjusted returns investors need to recalibrate their portfolios – pivoting away from traditional fixed income and toward well researched diversifiers that are uncorrelated and uncrowded. Our focus in this area is on transparency, consistency of return and sustainability of the business model. In the meantime, we remain ever vigilant regarding the direction of interest rates and will consider fixed income investments when rates and credit spreads provide proper compensation for risk.
End Notes:
1. Start dates for the individual asset classes vary and are based on the earliest data available. Note: Assets/indices and start dates: 10Y U.S. Inflation Linked Bonds: U.S. Generic Govt TII 10-Year (Jan-97), 10Y U.S. Treasury Bond: U.S. Generic Govt 10-Year Yield (Jan-62), Municipal Bonds: Bloomberg Barclays Municipal Bond Index (Jan-80), IG Fixed Income: Bloomberg Barclays U.S. Aggregate Bond Index (Jan-76), HY Muni: Bloomberg Barclays Municipal Custom High Yield Composite (Dec-95), Emerging Market USD Debt: Bloomberg Barclays EM USD Aggregate Bond Index (Jan-93), Leveraged Loans: S&P/LSTA U.S. Leveraged Loan 100 Index (Sep-12), HY Corporate Bonds: Bloomberg Barclays U.S. Corporate High Yield Bond Index (Jan-87) and U.S. Preferred Stock: iShares Preferred and Income Securities ETF (Mar-07).
2. Maximum Drawdowns are presented on a total return basis and are based on the earliest data available for the corresponding indices. Note: Assets/indices: 10Y U.S. Inflation Linked Bonds: Bloomberg Barclays U.S. TIPS, 10Y U.S. Treasury Bond: ICE BofAML 10+ Year U.S. Treasury, Municipal Bonds: Bloomberg Barclays Municipal Bond Index, IG Fixed Income: Bloomberg Barclays U.S. Aggregate Bond Index, HY Muni: Bloomberg Barclays Municipal Custom High Yield Composite, Emerging Market USD Debt: JPM EMBI+, Leveraged Loans: S&P/LSTA U.S. Leveraged Loan 100 Index, HY Corporate Bonds: Bloomberg Barclays U.S. Corporate High Yield Bond Index and U.S. Preferred Stock: ICE BofAML Fixed Rate Preferred Securities.
3. Research in process.
Disclosures:
The information provided is educational and general in nature and is not intended to be, nor should it be construed as, specific investment advice. Individuals should seek advice from their wealth advisor or other advisors before undertaking actions in response to the matters discussed. No client or prospective should assume the above information serves as the receipt of, or substitute for, personalized individual advice. Because of the many variables involved, individuals should not rely on this report alone.
This reflects the opinions of Focus Partners or its representatives, may contain forward-looking statements, and presents information that may change. Nothing contained in this communication may be relied upon as a guarantee, promise, assurance, or representation as to the future.Past performance does not guarantee future results. Market conditions can vary widely over time, and certain market and economic events having a positive impact on performance may not repeat themselves. The charts and accompanying analysis are provided for illustrative purposes only. Investing involves risk, including, but not limited to, loss of principal. Focus Partners' opinions may change over time due to market conditions and other factors. Numerous representatives of Focus Partners may provide investment philosophies, strategies, or market opinions that vary. The appropriateness of a particular investment or strategy will depend on an investor's individual circumstances and objectives.
Although recently updated, it originally was authored in October 2020– before The Colony Group, LLC changed its name to Focus Partners. This is prepared using third party sources considered to be reliable; however, accuracy or completeness cannot be guaranteed. The information provided will not be updated any time after the date of publication.
Services are offered through Focus Partners Wealth, LLC (“Focus Partners”), an SEC registered investment adviser with offices throughout the country. Registration with the SEC does not imply a certain level of skill or training and does not imply that the SEC has endorsed or approved the qualifications of Focus Partners or its representatives.
Prior to January 2025, Focus Partners was named The Colony Group, LLC. Focus Partners has been part of the Focus Financial Partners partnership since 2011.
©2025 Focus Partners Wealth, LLC. All rights reserved. RO-25-4802409
Category
InvestingAbout the Author

Pier Friend
Chief Investment Officer, Institutional Advisory Practice