
September 16, 2026
What $40 Trillion in Debt Means for Your Portfolio

Last month, the national debt crossed $40 trillion for the first time. While the total debt number is staggering, the cost of serving the debt matters more than the total amount.
Interest rates are higher, and the cost of servicing the national debt has been rising mechanically as old bonds mature and are replaced by new issues at higher interest rates. The average rate on outstanding U.S. Treasury debt was 3.3% in January 2026 versus 1.5% five years ago.
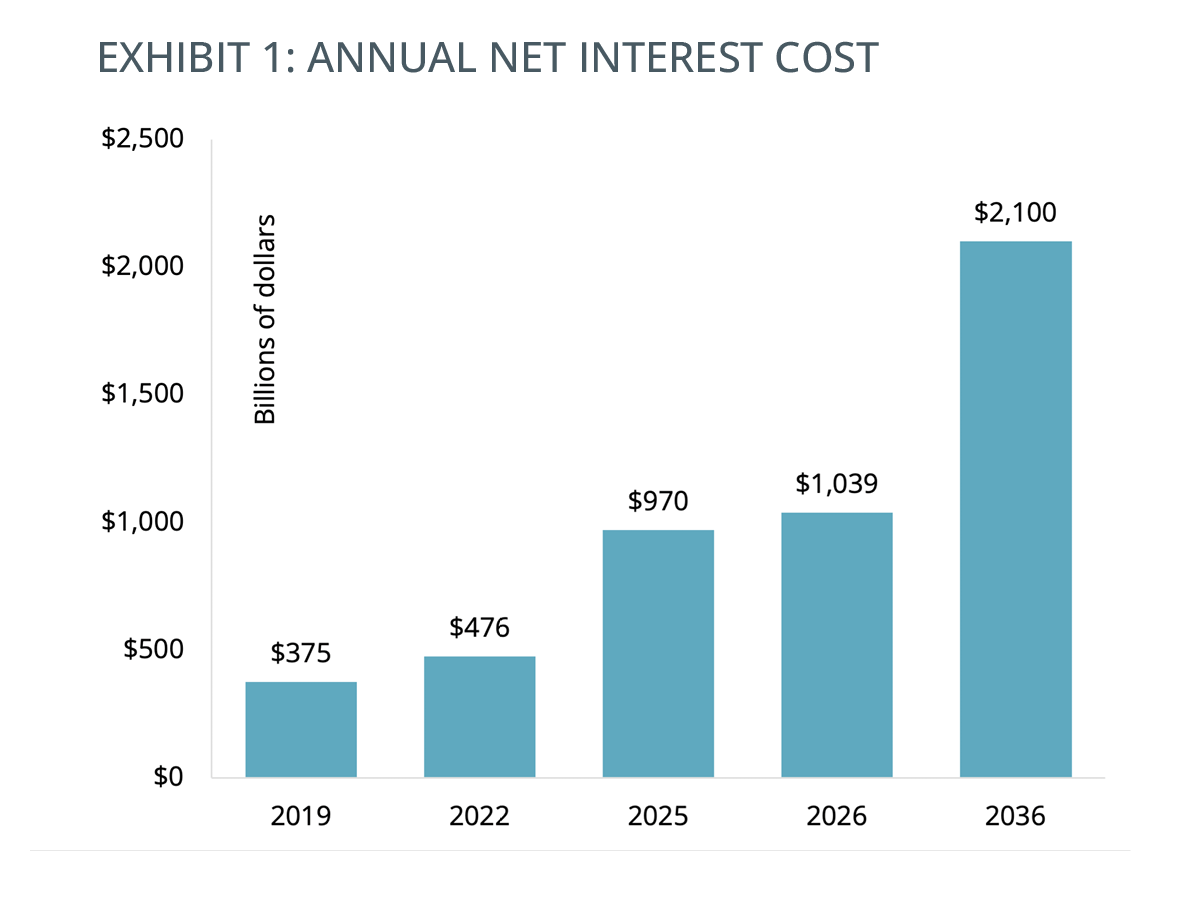
Exhibit 1 shows how the rising rate, along with the quantity of debt rising from roughly $28 trillion to $40 trillion, has translated into rising annual net interest costs, which are expected to more than double from 2026 to 2036 according to the Congressional Budget Office (CBO) projections.
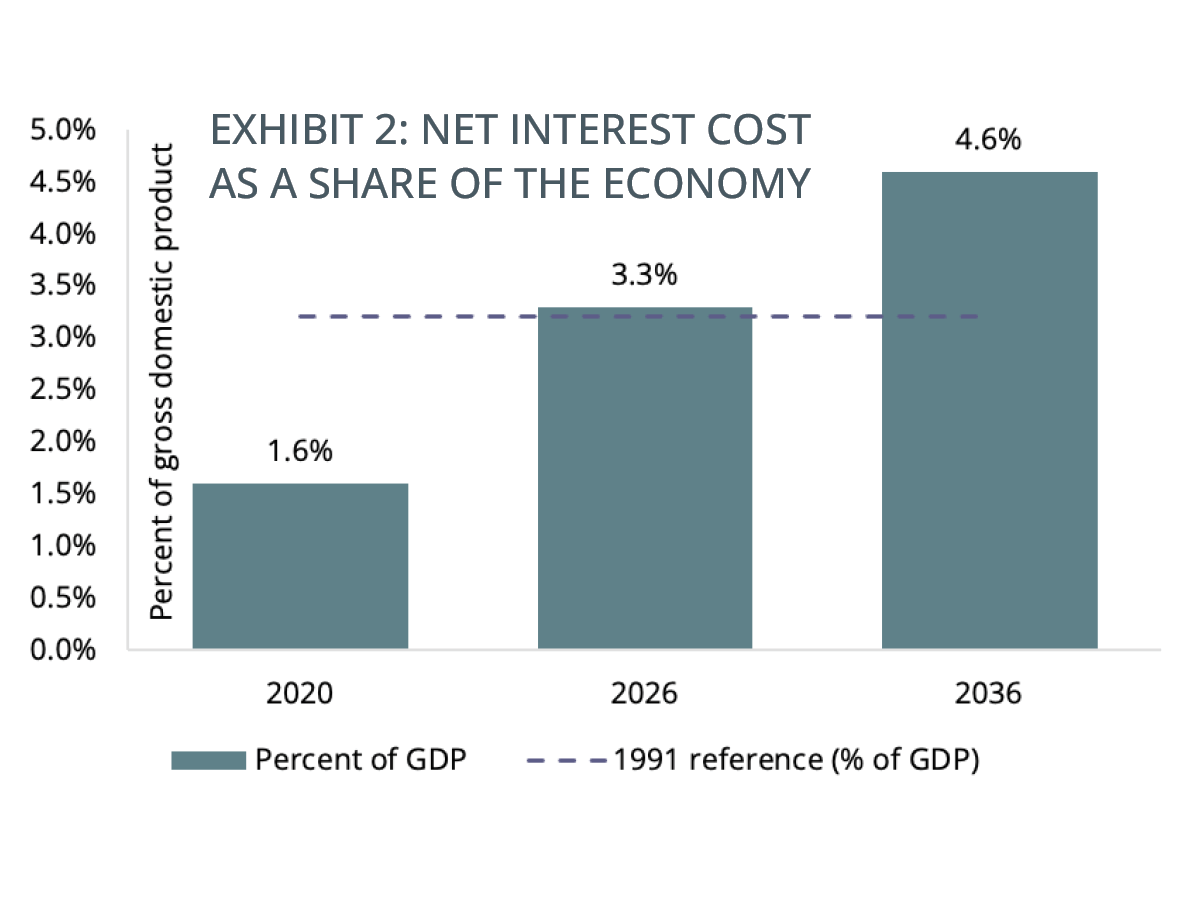
As shown in Exhibit 2, net interest costs currently represent 3.3% of the economy, which marks the first year net interest exceeds the 1991 postwar high as a share of GDP.
Gross Federal Debt vs. Debt Held by the Public
From time to time, you may see commentators make the mistake of using different measures of the debt interchangeably. To define terms: gross federal debt is the sum of virtually all debt the federal government owes, including what it owes to itself. Debt held by the public is all debt that the federal government owes to those outside the federal government.
Both gross debt and debt held by the public are important measures, but for different reasons. Most economists regard debt held by the public, particularly when measured as a share of GDP, to be the most economically meaningful measure of debt. Gross debt measures the government’s total obligations, and after some minor adjustments, it determines when the government will hit the national debt limit.
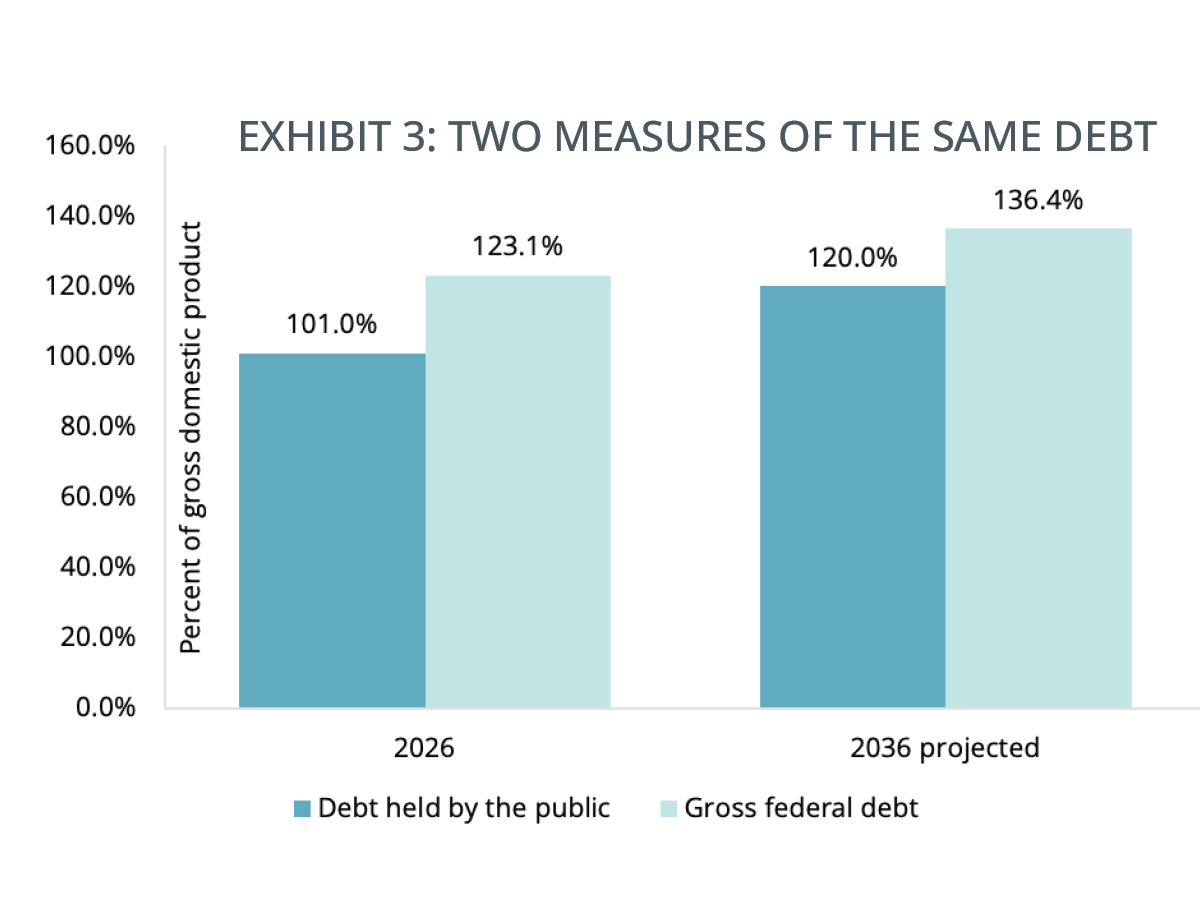
As shown in Exhibit 3, both numbers are projected to continue to rise over the next 10 years.
How Rising Government Debt Affects Interest Rates
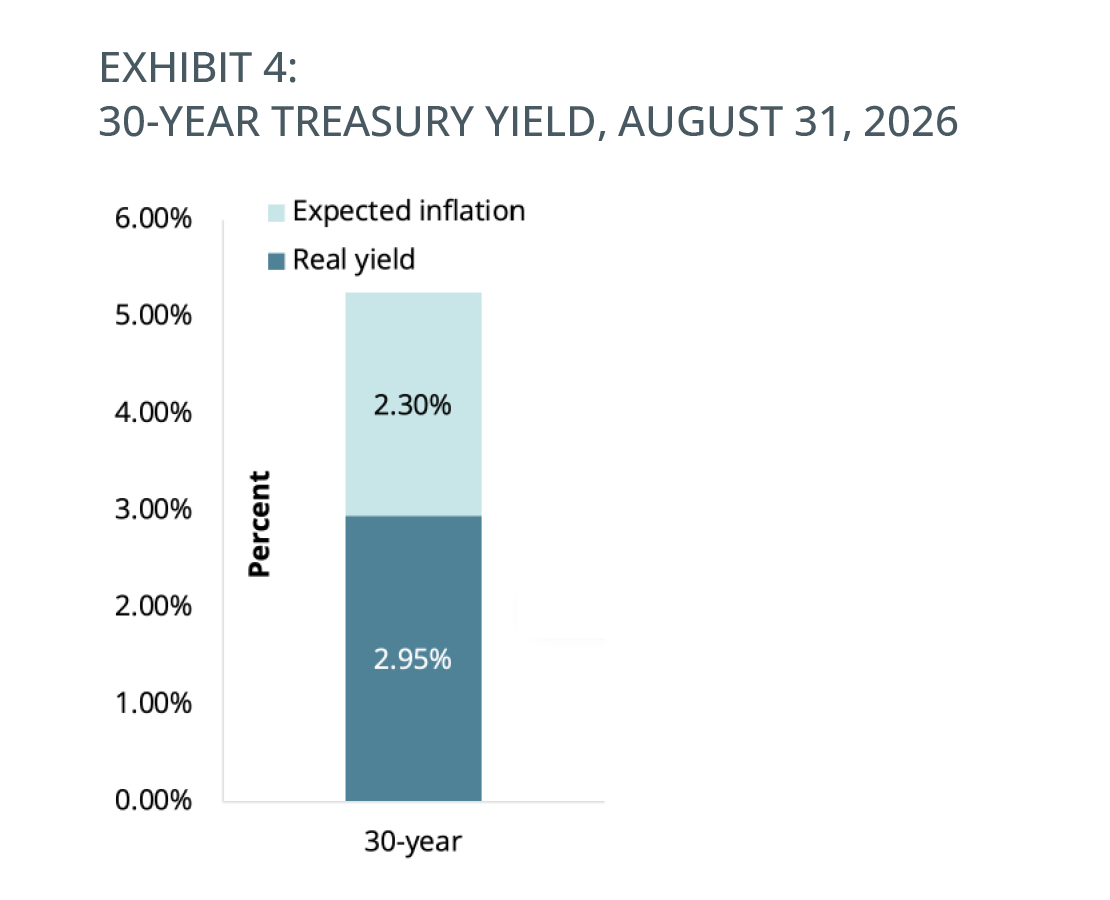
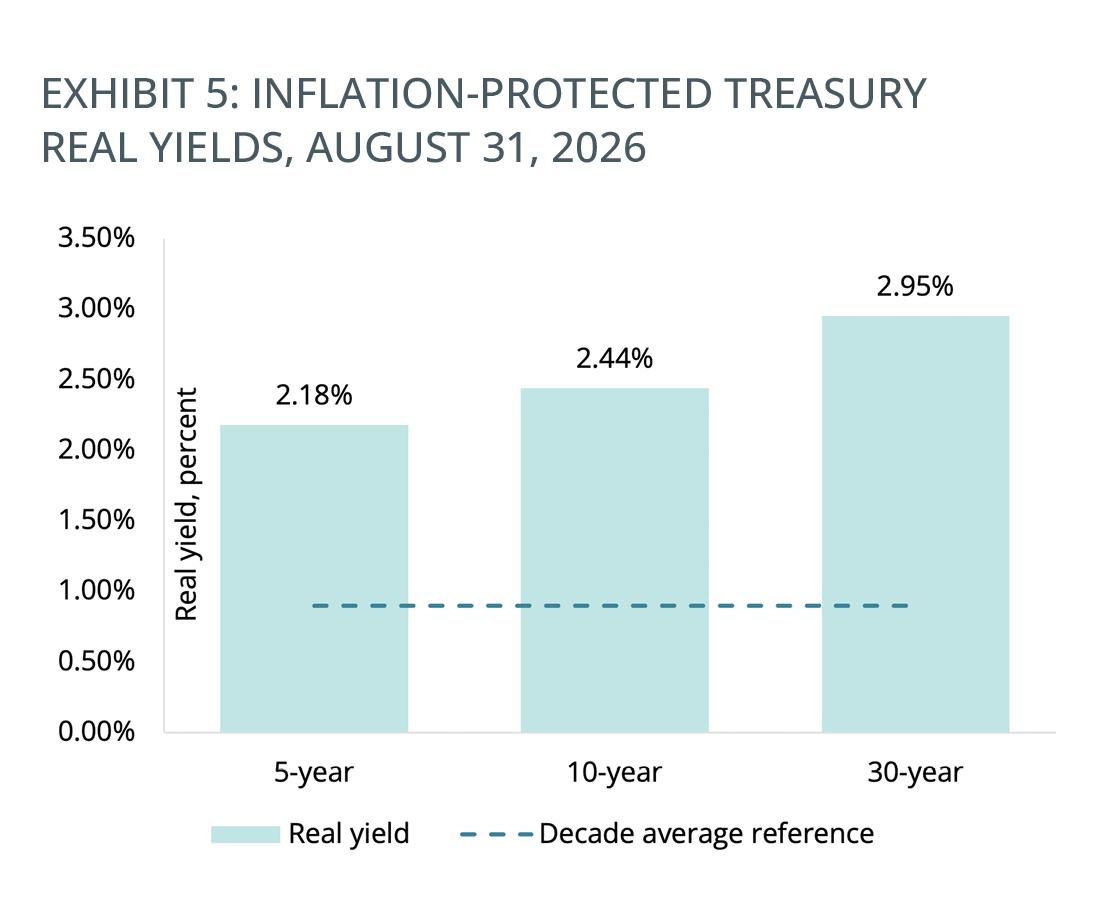
Government yields are the baseline for nearly all other borrowing, so it spreads into corporate credit, mortgage rates, and the cost of capital across the economy. In August, the yield on a 30-year Treasury bond reached levels not seen since 2007, closing the month at 5.25%. The yield on a 30-year Treasury Inflation-Protected Security, or TIPS bond, reached levels never seen since the Treasury began issuing 30-year TIPS in 2010, closing the month at 2.95%.
The market’s expectation for future inflation can be calculated as the difference between the yield on a nominal Treasury bond and the real yield on a TIPS bond. As shown in Exhibit 4, the market is expecting inflation of 2.30% over the next 30 years. Inflation expectations have been remarkably well anchored in the 2.1 – 2.4 percent range over the past two years.
It is also notable that the observed rise in interest rates is not unique to the United States. The yield on Japanese 10-year bonds is above 3% for the first time since 1996. German 10-year bunds are at their highest yields since 2011. British 10-year gilts are at their highest yields since 2008.
If inflation expectations are not rising, then as depicted in Exhibit 5, the primary explanation for higher interest rates is that investors are now demanding a higher real interest rate than they did for most of the past 10 years. Higher real yields mean that bonds offer greater expected returns now than at any point in the last 15 years.
How Rising Government Debt Affects Stocks
Economists get concerned as debt-to-GDP rises, although there is no hard and fast rule as to what level is a “problem” for economies. Debt held by the public is currently 101% of GDP and is expected to pass the 1946 record of 106% in 20230, then eventually reach 120% by 2036. Gross federal debt is 123% of GDP now and is expected to reach 136% by 2036.
Optimists might argue that the United States will be able to grow its way out of this problem by growing the denominator of the debt-to-GDP ratio. A paper by Elmendorf, Hubbard, and Liscow examined seven policy areas that could raise economic growth and concluded that growth alone almost certainly cannot stabilize the debt. Stabilizing it would require productivity growth to rise from about 1.1% to 1.6% and stay there, and they found no evidence that policy reliably delivers that. Faster growth helps. It shrinks the eventual tax increases or spending cuts, but it does not replace them.
High national debt has not been a reliable signal to reduce stock exposure. Dimensional Fund Advisors looked at every year since 1975 in which a country’s debt exceeded 100% of its output. Across 153 of those instances, stocks were positive about two-thirds of the time. Japan has been above 200% since 2010. Markets price in what is already known, and the level of government debt is about the slowest-moving, most widely discussed topic in finance.
How the National Debt Impacts Your Portfolio
Rising national debt is a risk that is considered in a well-constructed portfolio. Investors should evaluate how much exposure they have to interest rate risk, credit risk, and their sensitivity to unexpectedly high inflation.
Longer duration bonds have greater exposure to interest rate risk, meaning they will perform better as rates are falling and worse as rates are rising (as they have in 2026). Bonds of lower credit quality will tend to have higher yields, but that additional yield is compensation for the likelihood that lower credit quality bonds will become more correlated with stock markets during periods of market stress. Investors exposed to unexpectedly high inflation should consider allocations to TIPS or commodities, both of which have historically performed well during periods of unexpectedly high inflation.
The debt is a real long-term problem, but it is not a reason to abandon your plan.
Category
InvestingContent Topics
The information provided is educational and general in nature and is not intended to be, nor should it be construed as, specific investment, tax, or legal advice. Individuals should seek advice from their wealth advisor or other advisors before undertaking actions in response to the matters discussed. No client or prospective should assume the above information serves as the receipt of, or substitute for, personalized individual advice. This reflects the opinions of Focus or its representatives, may contain forward-looking statements, and presents information that may change. Nothing contained in this communication may be relied upon as a guarantee, promise, assurance, or representation as to the future. Past performance does not guarantee future results. Market conditions can vary widely over time, and certain market and economic events having a positive impact on performance may not repeat themselves. Investing involves risk, including, but not limited to, loss of principal. Focus' opinions may change over time due to market conditions and other factors. Numerous representatives of Focus may provide investment philosophies, strategies, or market opinions that vary. The appropriateness of a particular investment or strategy will depend on an investor's individual circumstances and objectives. Please be advised that Focus only shares video and content through our website or other official sources. Services and investment advice are only provided pursuant to an advisory agreement with the client. Services are offered through Focus Partners Wealth, LLC (“Focus”), an SEC registered investment adviser with offices throughout the country. Registration with the SEC does not imply a certain level of skill or training and does not imply that the SEC has endorsed or approved the qualifications of Focus or its representatives. Focus has been part of the Focus Financial Partners partnership since 2011. ©2026 Focus Financial Partners, LLC. All rights reserved. RO-26-5904696
About the Author

Kevin Grogan
Chief Investment Officer of Systematic Strategies